Power BI DAX is a programming language is used in Microsoft Power BI to carry out calculated columns, create tabled and custom Measures. It is used to carry out analysis on the data either Loaded from an Excel or Database, Microsoft Power Bi supports Databases Like Oracle, SQL, Postgre SQL, It also supports the use of python to carry out Advanced Data Analysis.
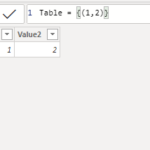
We can use Power BI DAX functions to create a table, We are going to explain the use of Power BI DAX to create a table using the example below:

data 1 refers to the value in the first column and data 2 represents the value in the second column, in a situation, we want to have rows and columns, the example below shows how it is implemented.

Represent the first and second row of data having two columns, to be in a position to represent Multiple rows and columns in the table the sample below is what represents, Power BI usually detects the column data type whether whole number, text, or DateTime. Table = {(1,2),(3,4)}

One thing we need to consider always in using the Power BI DAX function is to ensure that all rows have the same number of rows
Conclusion
Using the Power BI DAX Function to create a table is simple and fast, however, there are some limitations on the column names and the data types making it a challenge when doing customization.


Leave a Reply